I. Introduction
This article provides a reference for tyre procurement decisions. The first part reviews the 2025 Global Tyre 75 ranking, analyzing the decline of traditional giants like Michelin, Bridgestone, and Goodyear, and the growth of Chinese companies like Zhongce and Sailun. The second part, based on 2026 financial data, examines the industry’s dilemma of “rising sales, falling profits” and its causes. The third part explains how Forlander delivers near-top-tier performance at a lower price. When evaluating the top tyre brands in the world, buyers should look beyond traditional names because the market landscape has changed.

II. 2025 Global Tyre 75 Ranking: Three Changes
According to the 2025 Global 75 ranking by Tire Business (based on 2024 sales data), the industry shows three shifts:
| Rank 2025 | Rank 2024 | Tyre Company | Country/Region | 2024 Sales | 2023 Sales | YoY Change |
| 1 | 1 | Michelin | France | 256.47 | 272.70 | -5.95% |
| 2 | 2 | Bridgestone | Japan | 247.70 | 261.00 | -5.10% |
| 3 | 3 | Goodyear | USA | 174.47 | 186.99 | -6.70% |
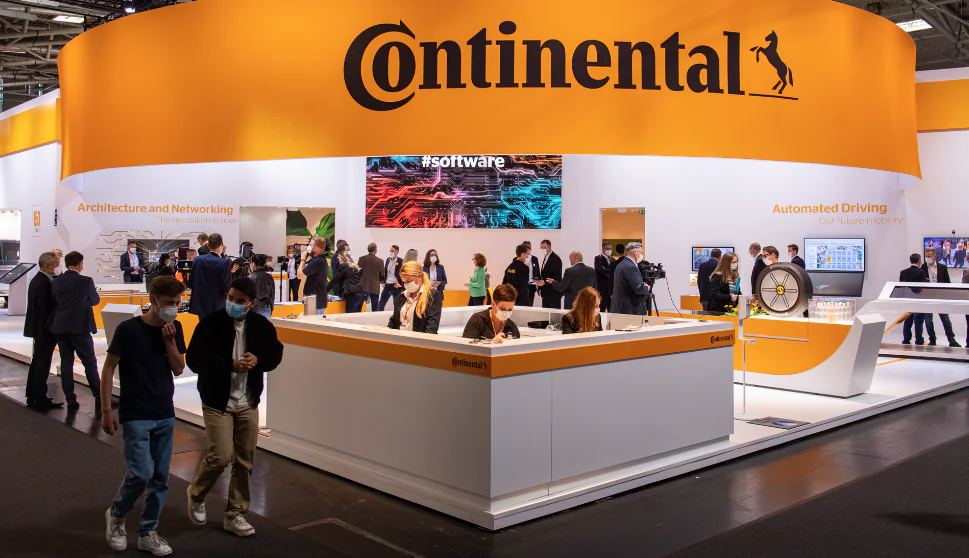
| 4 | 4 | Continental | Germany | 124.66 | 125.00 | -0.27% |
| 5 | 5 | Pirelli | Italy | 73.29 | 74.00 | -0.96% |
| 6 | 6 | Sumitomo Rubber | Japan | 69.07 | 71.65 | -3.60% |
| 7 | 7 | Hankook Tire | South Korea | 68.45 | 66.43 | 3.04% |
| 8 | 8 | Yokohama Rubber | Japan | 64.75 | 62.29 | 3.95% |
| 9 | 9 | Zhongce Rubber | China | 52.04 | 47.72 | 9.05% |
| 10 | 10 | Sailun Tire | China | 43.63 | 36.04 | 21.06% |
| 11 | 11 | Toyo Tire | Japan | 34.33 | 35.98 | -4.59% |
| 12 | 13 | Kumho Tire | South Korea | 33.20 | 30.96 | 7.24% |
| 13 | 15 | MRF | India | 32.78 | 29.95 | 9.45% |
| 14 | 14 | Apollo Tyres | India | 30.82 | 30.90 | -0.26% |
| 15 | 17 | Linglong Tire | China | 30.69 | 28.43 | 7.95% |
| 16 | 12 | Cheng Shin Rubber | Taiwan, China | 29.98 | 33.35 | -10.10% |
| 17 | 16 | Giti Tire | Singapore | 29.44 | 29.66 | -0.74% |
| 18 | 18 | Nexen Tire | South Korea | 22.73 | 21.92 | 3.70% |
| 19 | 19 | JK Tyre | India | 17.66 | 18.22 | -3.07% |
| 20 | 23 | CEAT Tyres | India | 15.79 | 14.24 | 10.88% |
| 21 | 24 | Prinx Chengshan | China | 15.25 | 13.75 | 10.91% |
| 22 | 22 | Double Coin Group | China | 15.24 | 14.32 | 6.42% |
| 23 | 20 | PTG | Italy | N.A. | 14.83 | / |
| 24 | 25 | Guizhou Tire | China | 14.76 | 13.45 | 9.74% |
| 25 | 21 | Triangle Tire | China | 14.03 | 14.60 | -3.90% |
| 26 | 27 | Nokian Tyres | Finland | 13.02 | 11.42 | 14.01% |
| 27 | 26 | Sun Tyres | India | N.A. | 12.50 | / |
| 28 | 29 | Sentury Tire | China | 11.83 | 11.04 | 7.16% |
| 29 | 33 | Jinyu Tire | China | 11.59 | 9.53 | 21.62% |
| 30 | 30 | BKT | India | 11.20 | 10.25 | 9.27% |
| 31 | 28 | Kenda Tire | Taiwan, China | 10.65 | 11.04 | -3.53% |
| 32 | 35 | Bridgestone-Sabanci | Turkey | 10.55 | 8.56 | 23.25% |
| 33 | 31 | Titan International | USA | 10.17 | 10.02 | 1.50% |
| 34 | 34 | Huasheng Rubber | China | 9.75 | 8.76 | 11.30% |
| 35 | 32 | Haohua Tire | China | 9.65 | 9.75 | -1.03% |
| 36 | 45 | General Science | China | 9.61 | 7.06 | 36.12% |
| 37 | 40 | Fengshen Tire | China | 9.02 | 7.93 | 13.75% |
| 38 | 36 | Yongsheng Rubber | China | N.A. | 8.56 | / |
| 39 | 50 | Fangxing Rubber | China | 8.46 | 5.61 | 50.80% |
| 39 | 38 | Shandong Wanda Tire | China | 8.46 | 8.10 | 4.44% |
| 41 | 42 | Wanli Tire | China | 8.27 | 7.68 | 7.68% |
| 42 | 41 | Zhengdao Tire | China | N.A. | 7.91 | / |
| 43 | 44 | Cordiant | Russia | N.A. | N.A. | / |
| 44 | 37 | Changfeng Tire | China | 7.21 | 8.22 | -12.29% |
| 45 | 49 | Zhongyi Rubber | China | 7.19 | 5.86 | 22.70% |
| 46 | 43 | Petlas Tire | Turkey | N.A. | 7.12 | / |
| 47 | 39 | Haida Group | China | 6.56 | 7.94 | -17.38% |
| 48 | 36 | Xiongying Tire | China | 6.43 | 6.71 | -4.17% |
| 49 | 47 | Doublestar Tire | China | 6.02 | 6.58 | -8.51% |
| 50 | 50 | Fomaisi | China | 5.58 | 5.67 | -1.59% |
| 51 | 52 | Chaoyang Langma | China | 5.44 | 5.12 | 6.25% |
| 52 | 51 | Yongfeng Tire | China | 5.02 | 5.48 | -8.39% |
| 53 | 56 | Barez Tire | Iran | 3.99 | 3.55 | 12.39% |
| 54 | 55 | TVS Srichakra | India | 3.89 | 3.55 | 9.58% |
| 55 | 54 | Xulun Rubber | China | 3.82 | 3.81 | 0.26% |
| 56 | 67 | FATE Tire | Argentina | 3.51 | N.A. | / |
| 57 | 57 | Tianjin Wanda Tire | China | N.A. | 3.40 | / |
| 58 | N.R. | Yuelong Rubber | China | 3.31 | 2.26 | 46.46% |
| 59 | N.R. | Xinghongyuan Tire | China | 3.14 | 3.14 | 0.00% |
| 60 | 58 | Sanli Tire | China | 2.99 | 3.07 | -2.61% |
| 61 | 63 | Yanchang Rubber | China | 2.92 | 2.75 | 6.18% |
| 62 | 64 | Nankang Tire | Taiwan, China | 2.80 | 2.52 | 11.11% |
| 63 | 60 | Mileqi Tire | China | 2.63 | 2.82 | -6.74% |
| 64 | 65 | Fengyuan Tire | China | 2.57 | 2.28 | 12.72% |
| 65 | 61 | Bayi Rubber | China | 2.41 | 2.75 | -12.36% |
| 66 | N.R. | Emerald Tire | India | 2.17 | 1.87 | 16.04% |
| 67 | 66 | Casumina | Vietnam | 2.04 | 2.24 | -8.93% |
| 68 | 68 | ÖZKA Tyre | Turkey | N.A. | 1.91 | / |
| 69 | 69 | Daxiang Rubber | Vietnam | 1.87 | 1.89 | -1.06% |
| 70 | 71 | Nizhnekamskshina | Russia | N.A. | N.A. | / |
| 71 | 74 | Service Industries | Pakistan | N.A. | 1.52 | / |
| 72 | 72 | Specialty Tire | USA | N.A. | N.A. | / |
| 73 | 73 | Hwa Fong Rubber | Taiwan, China | 1.40 | 1.50 | -6.67% |
| 74 | 75 | Ralson Tire | India | N.A. | 1.34 | / |
| 75 | N.R. | Panther Tire | Pakistan | N.A. | 1.05 | / |
Change One: The top three declined
Michelin, Bridgestone and Goodyear hold the top three positions. Their sales declined more than 5%. Their combined share of total 75 sales fell to 38.81%, a ten-year low. Causes: global tyre market contraction (total 75 sales down nearly 3%), low auto sales in Europe and US, and Asian tyre competition in mid-to-low segments. When identifying the best tyre company for fleet operations, many buyers look beyond the top three.
Change Two: Chinese companies grew
39 Chinese companies made the list, the highest number. Zhongce Rubber ranked 9th with $5.204 billion (+9.1%)**. Sailun Group entered the global top 10 with **$4.363 billion (+21.1%). Jiangsu General (+36.1%), Fangxing Rubber (+50.8%) and Jinyu Tyre (+21.6%) led global growth. Total sales of 35 Chinese companies ($66.97 billion) is less than **2.7 times** Michelin’s sales ($25.674 billion). As a best tire manufacturer by volume, China shows progress.
Change Three: India grew
MRF Tyres ranked 13th with $3.278 billion. Apollo and JK Tyres achieved year-on-year growth.
Summary: Market share is shifting from Western to Asian brands. For the best tire brand in the world for trucking or delivery, Asian manufacturers are an option.

III. 2026 Tyre Industry: Revenue Up, Profit Down
Based on 2026 financial reports of listed tyre companies, the tire industry shows two characteristics:
Characteristic One: Sales up, profit down
Total sales of 22 tyre companies reached ~1,050.5 billion RMB, up 1.5% year-on-year. Most Chinese tyre companies show revenue growth with profit decline – sales volume up nearly 10% while profits drop due to a 20% rise in raw material costs. Operating costs of 11 listed Chinese tyre companies increased by ~17.6 billion RMB (+13%).
Characteristic Two: Top players hold, scale gap remains
Zhongce Rubber (44.956 billion RMB) rose to 7th globally. Sailun Tyre (36.792 billion RMB) achieved a record. Total sales of 11 foreign companies are five times that of 11 Chinese companies. Six Chinese companies have passed the 10 billion RMB sales mark. To reach the 50 billion RMB threshold for global top five, Chinese tyres need higher average prices. 18 companies that disclosed operating profits saw total profits decline more than 6.6% year-on-year.

Conclusion: Cost pressures and price wars squeeze margins. The tire industry in 2026 offers few easy paths to profit growth. Buyers should avoid brand premiums and low-price traps.
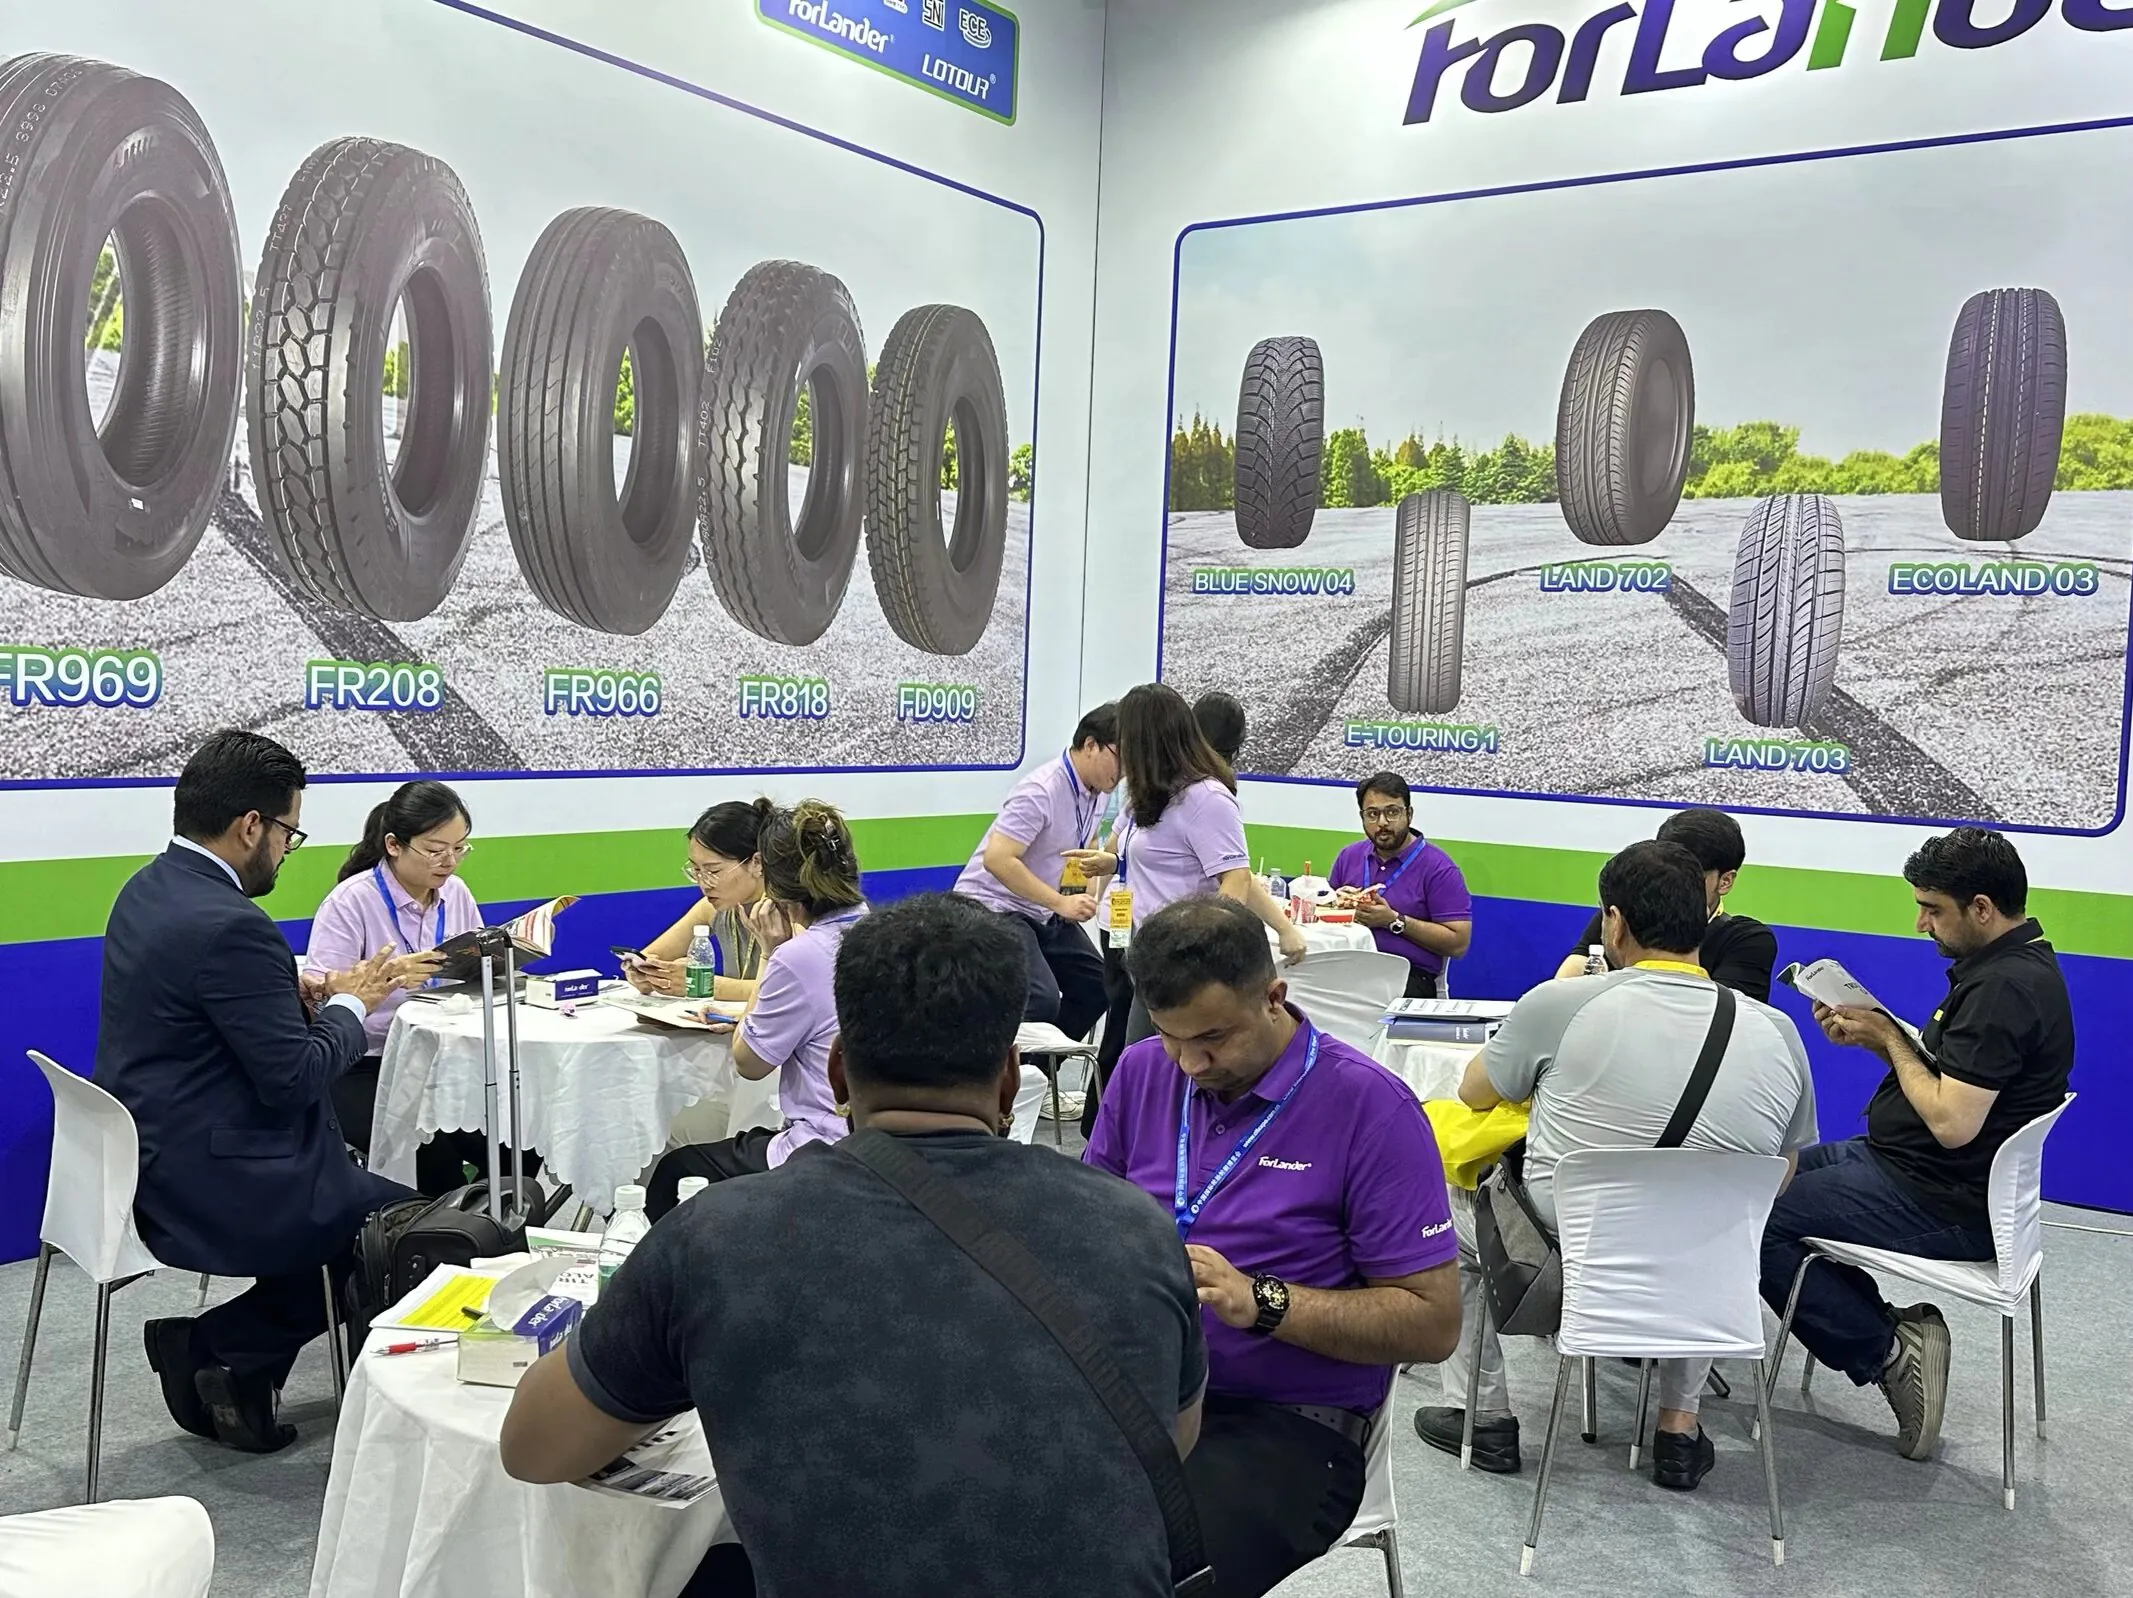
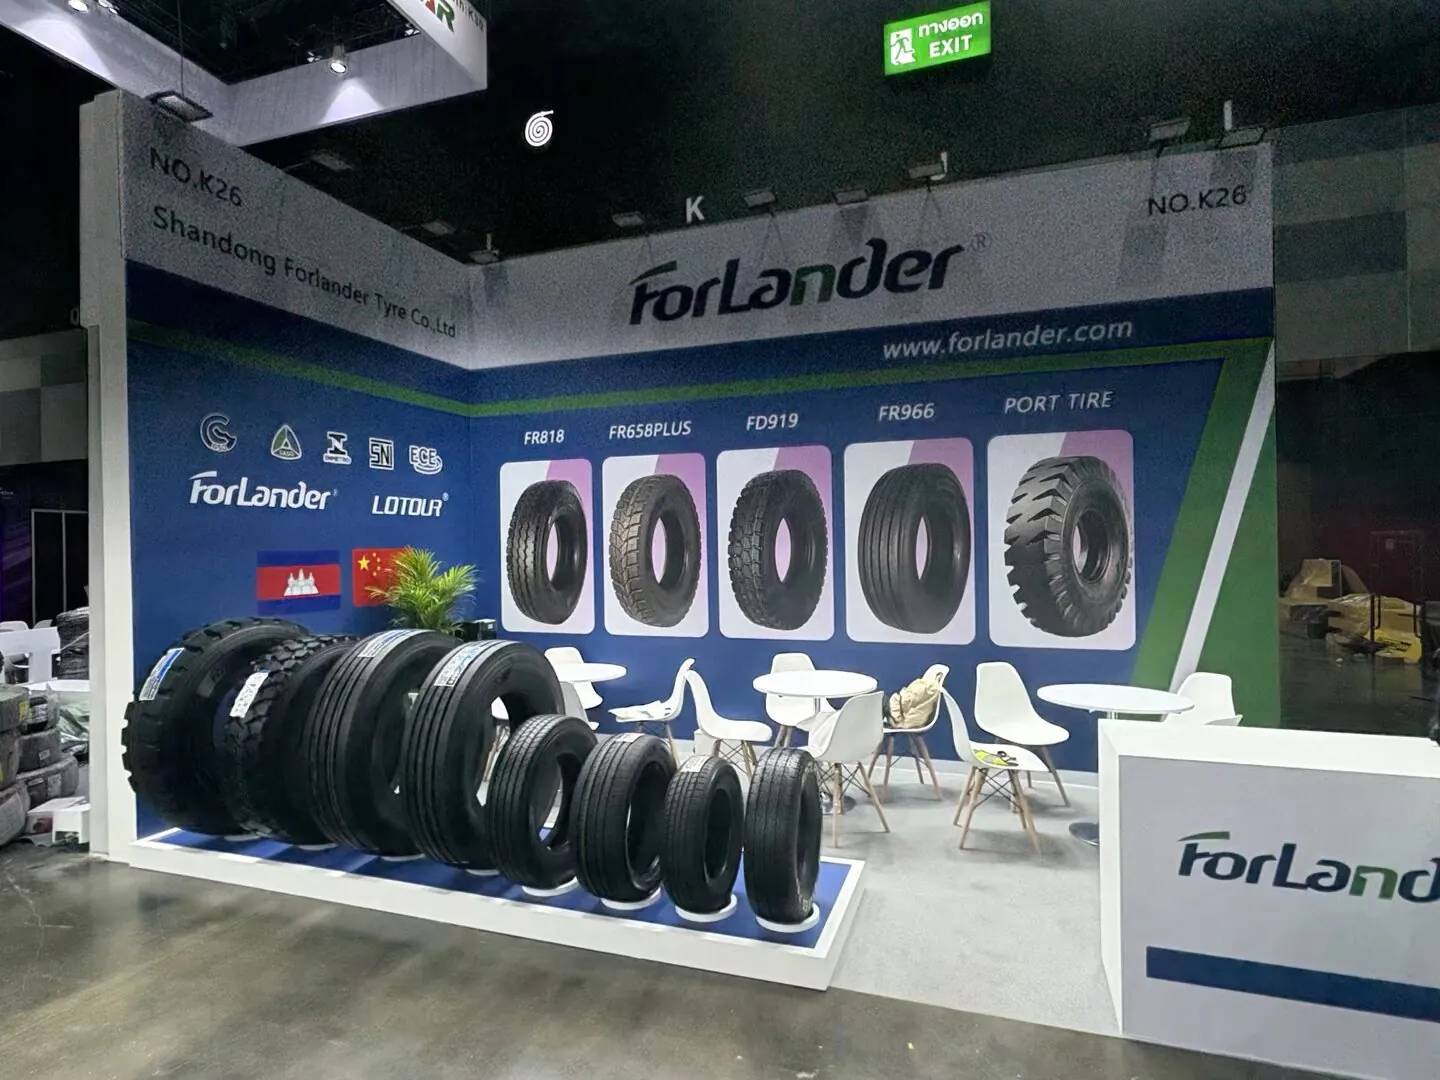
IV. Forlander Tyres
Based on the industry context above, Forlander is a practical purchase option. As cost pressures and price wars reshape the tyre market, Forlander delivers a balanced solution for buyers who need reliable performance without paying premium prices.
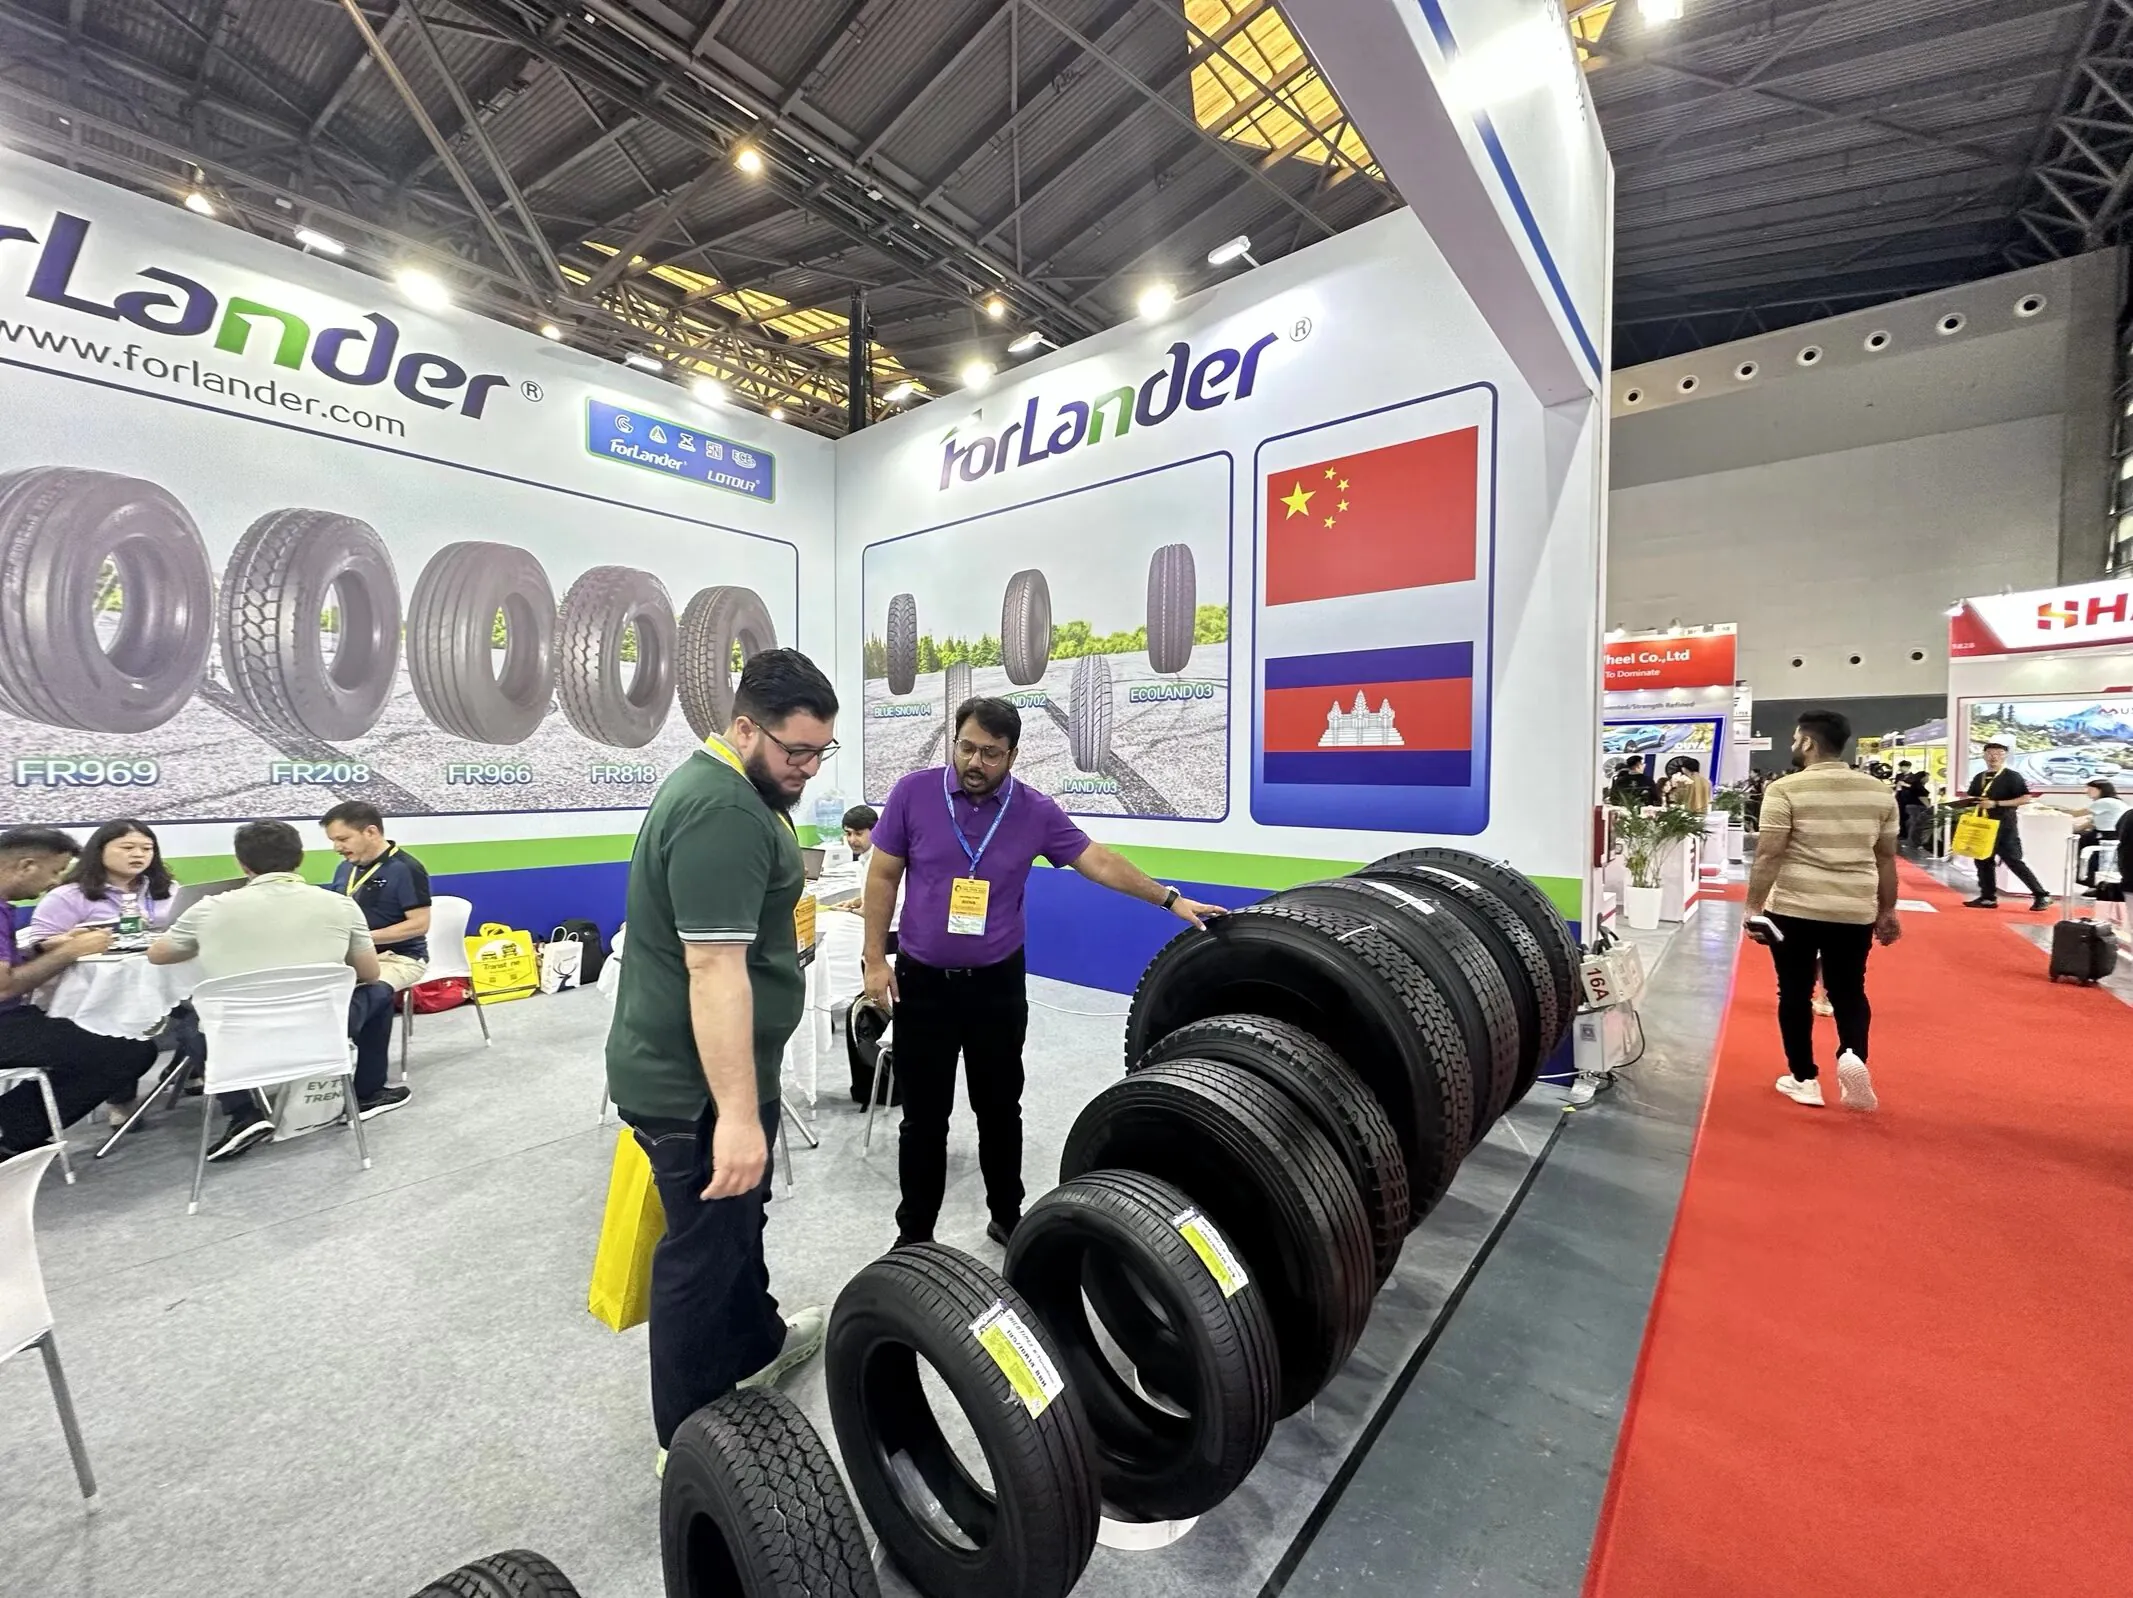
Brand Position
Forlander offers near-top-tier performance at a lower price point. It targets the sweet spot between expensive global brands and low-quality budget tyres.
Core Advantages
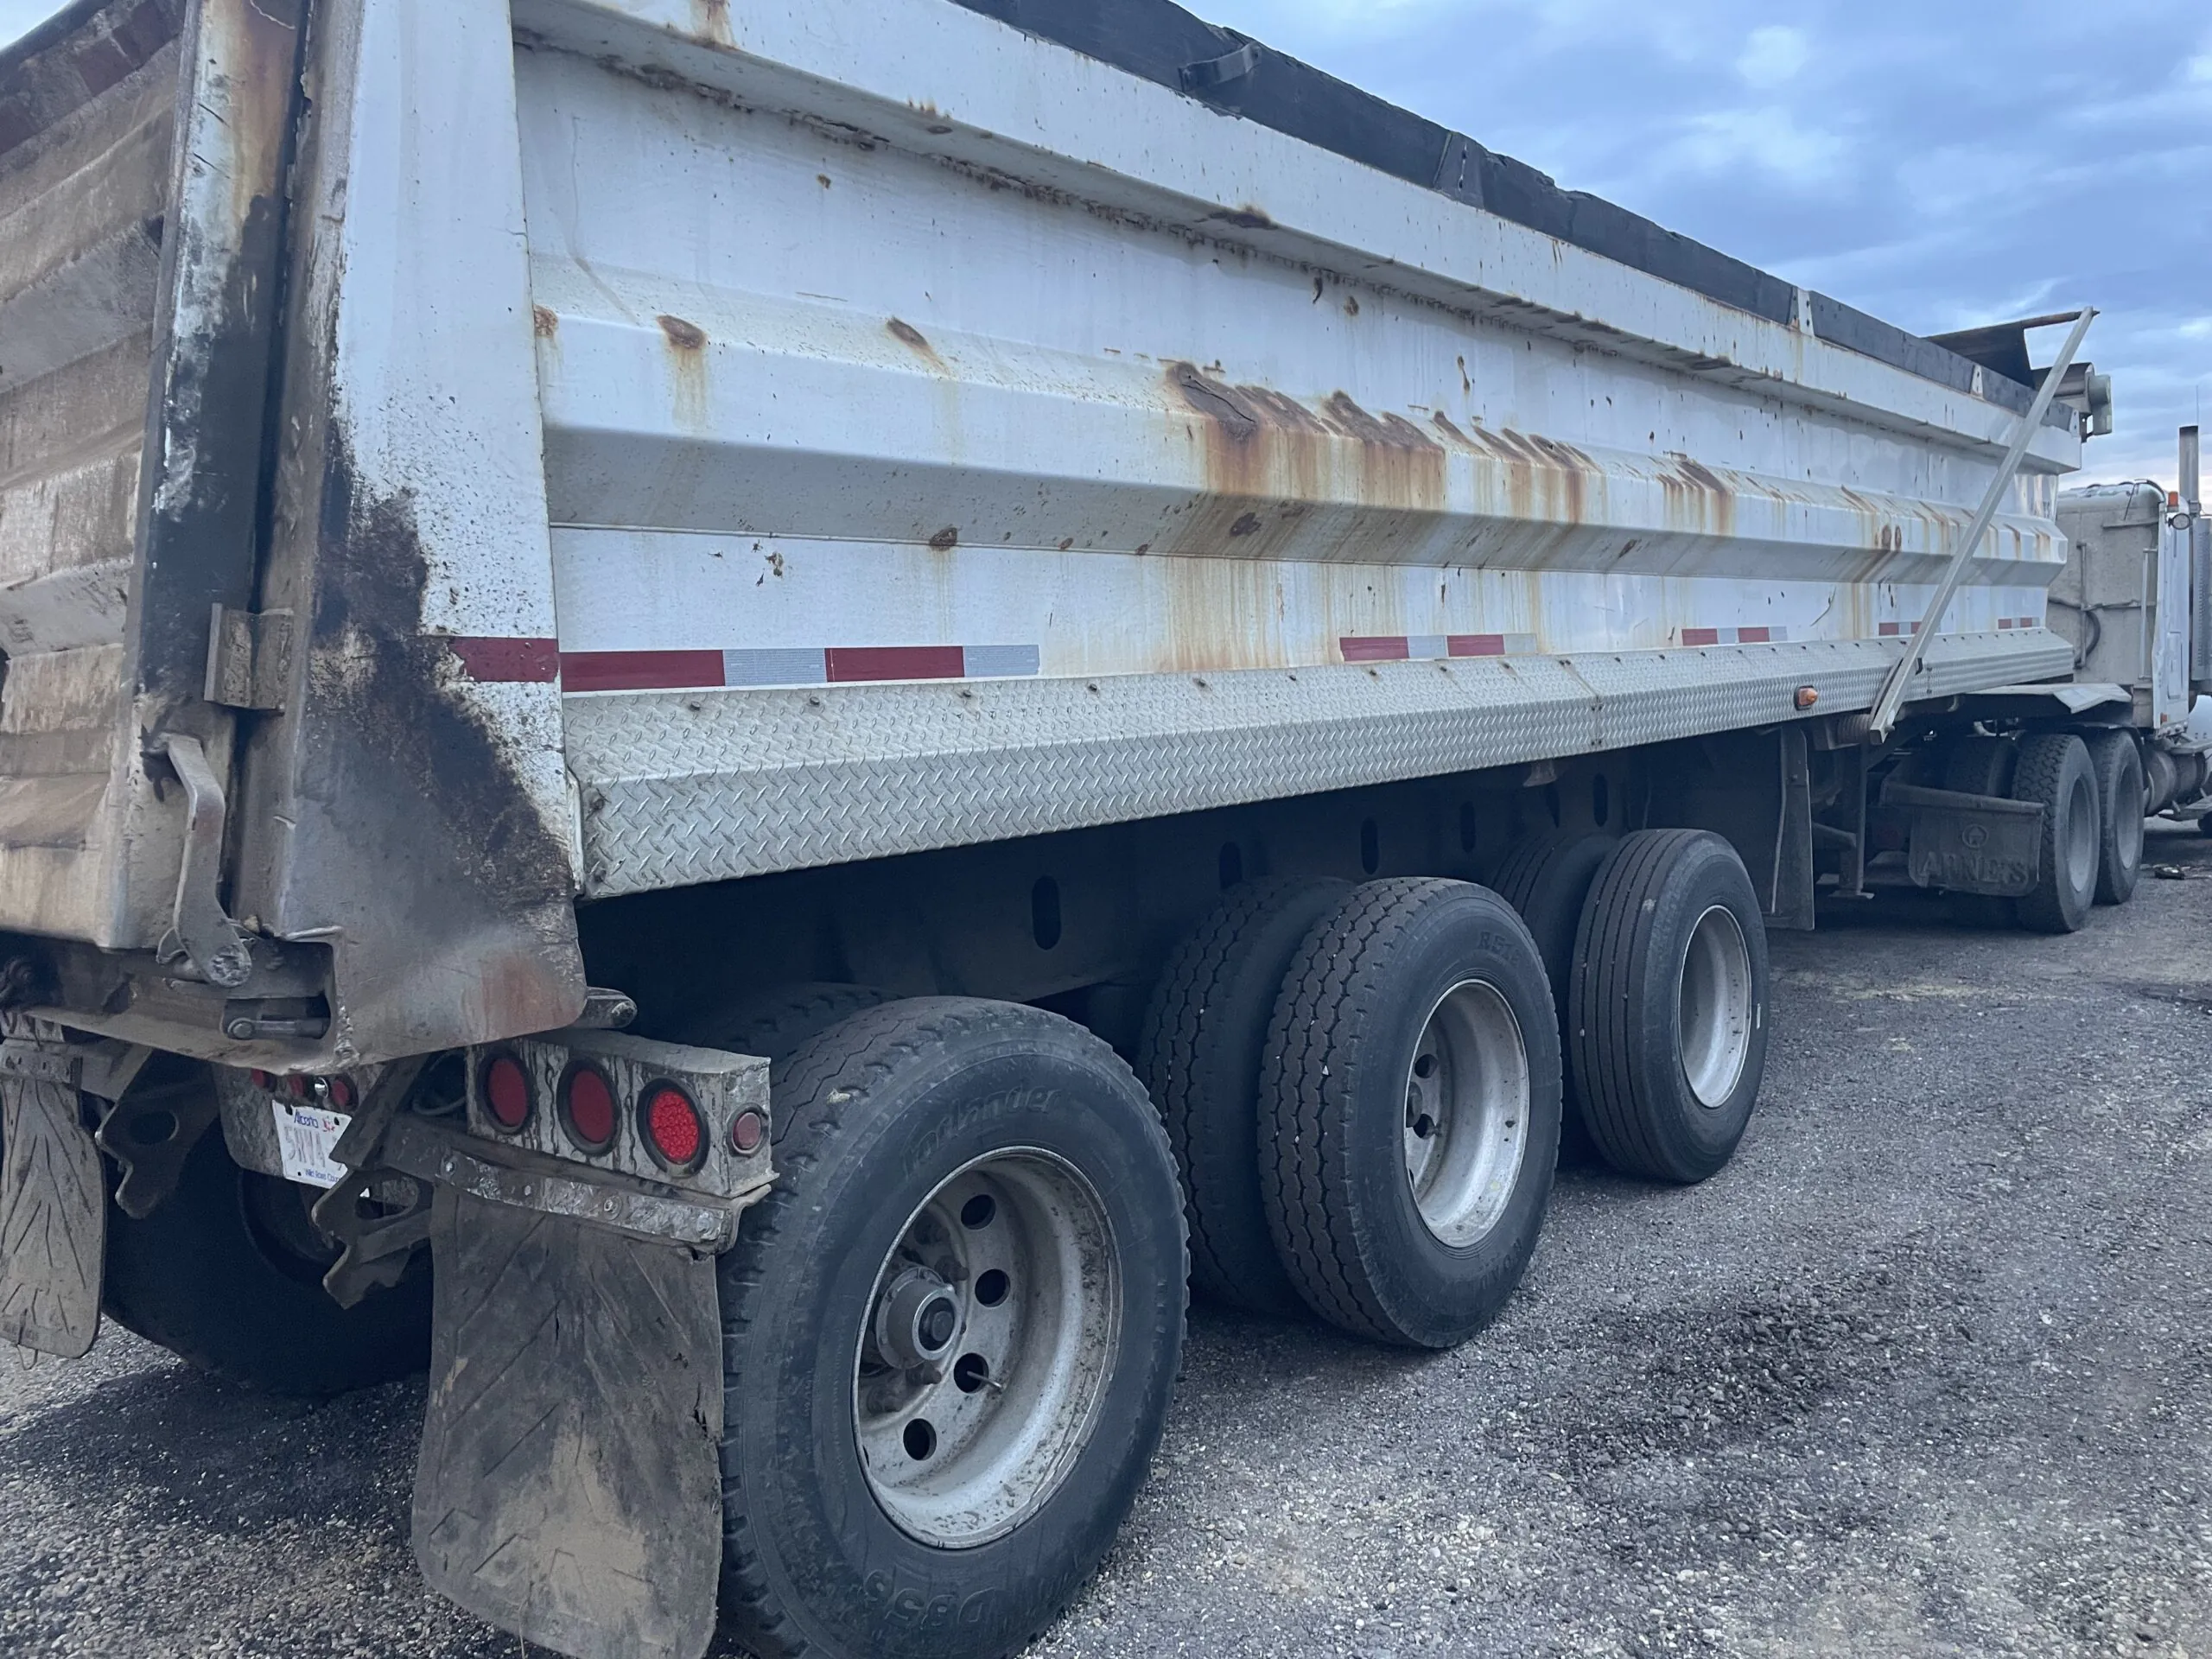
Supply chain strength: Forlander shares supply chains and manufacturing standards with large, established tyre groups. This ensures consistent quality.
Price stability: The parent group’s scale purchasing capabilities keep pricing stable and supply reliable, even when raw material costs rise.
Proven technology: Forlander uses tyre formulas and structures that have been tested and verified in commercial applications.
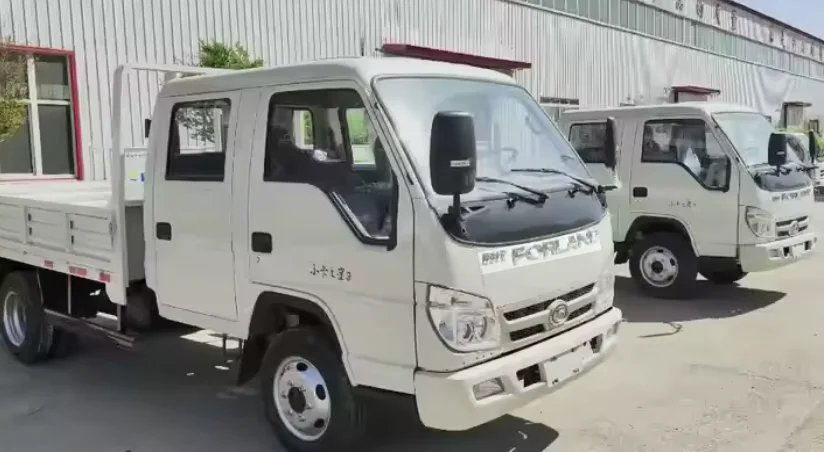
Product Categories
Forlander’s product portfolio covers a wide spectrum of applications, including PCR for passenger vehicles, TBR for trucks and buses, OTR for construction and mining equipment, port tyres for container handling, agricultural tyres for farm machinery, light truck tyres for vans and pickups, and white-letter tyres for aesthetic customization.
V. Conclusion
The 2025 Global 75 ranking shows Chinese tyre companies gained market share, with 39 Chinese firms making the list and Sailun Group entering the global top 10. The 2026 tire industry faces cost pressures, as raw material prices rise and price wars intensify, leaving most companies with revenue growth but declining profits. Forlander balances price and performance by offering near-top-tier quality at a lower price, backed by supply chains of large tyre groups. For buyers seeking a best tyre company, Forlander is a strong candidate. And for those focused on production excellence, it also represents a best tire manufacturer choice without the premium price tag.

